Annual Dose Contributions of Typical Indoor Radon Levels (Part 1)
Radiation protection specialists are used to thinking of radiation in terms of dose. Radon, on the other hand, is normally referred to in terms of its concentration in air, or in terms of its contribution to overall annual dose as part of natural background radiation. But how important, exactly, is radon’s contribution to annual dose?
According to the Canadian Nuclear Safety Commission (CNSC), inhaled radiation from radon makes up approximately half of the average Canadian’s annual effective dose from natural background radiation (0.9 mSv/year of an average 1.8 mSv/year). In some cities, it’s estimated to be substantially more, up to 78% in cities such as Winnipeg (3.2 mSv/year of a total 4.1 mSv/year).
While these estimates might be helpful as a general reference and a starting point, it’s well known that radon levels in indoor environments vary enormously depending on many factors, and actual effective doses will vary greatly from case to case.
Given that the only way to know the indoor radon level in a building is to measure it, let’s calculate the actual annual effective dose from radon at several different measured concentrations. Because of the COVID-19 pandemic, many Canadians are now working and attending school from home, which means estimating exposures has never been simpler.
For this exercise, let’s consider three people working or studying from home, who each spend approximately 22 hours per day indoors:
- Person A’s home tested at half the current Canadian guideline level, 100 Bq/m3
- Person B’s home tested at exactly the current Canadian guideline level, 200 Bq/m3
- Person C lives in Dauphin, MB, where homes tested at 557 Bq/m3
The community of Dauphin, MB, participated in Take Action on Radon’s 100 Radon Test Kit Challenge from the fall of 2019 to the spring of 2020. Eighty-seven homes were tested for radon, and 557 Bq/m3 represents the average of all the radon levels measured.
Using a conversion factor of a 1 mSv/year effective dose as equal to 300 kBq•h•m−3, as per Health Canada’s publication Reducing Radon in Existing Homes: a Canadian Guide for Professional Contractors, the annual effective dose may be calculated as follows:
Person A (100 Bq/m3)
| (22 hours/day)(365 days/year) | = | 8,030 hours/year | |||
| (8,030 hours/year)(100 Bq/m3) | = | 803,000 Bq•h•m−3/year | = | 803 kBq•h•m−3/year | |
| (803 kBq•h•m−3/year)[(1 mSv/year)/(300 kBq•h•m−3)] | = | 2.67 mSv/year |
Person B (200 Bq/m3)
| (22 hours/day)(365 days/year) | = | 8,030 hours/year | |||
| (8,030 hours/year)(200 Bq/m3) | = | 1,606,000 Bq•h•m−3/year | = | 1,606 kBq•h•m−3/year | |
| (1,606 kBq•h•m−3/year)[(1 mSv/year)/(300 kBq•h•m−3)] | = | 5.35 mSv/year |
Person C (557 Bq/m3)
| (22 hours/day)(365 days/year) | = | 8,030 hours/year | |||
| (8,030 hours/year)(557 Bq/m3) | = | 4,472,710 Bq•h•m−3/year | = | 4,472.71 kBq•h•m−3/year | |
| (4,472.71 kBq•h•m−3/year)[(1 mSv/year)/(300 kBq•h•m−3)] | = | 14.9 mSv/year |
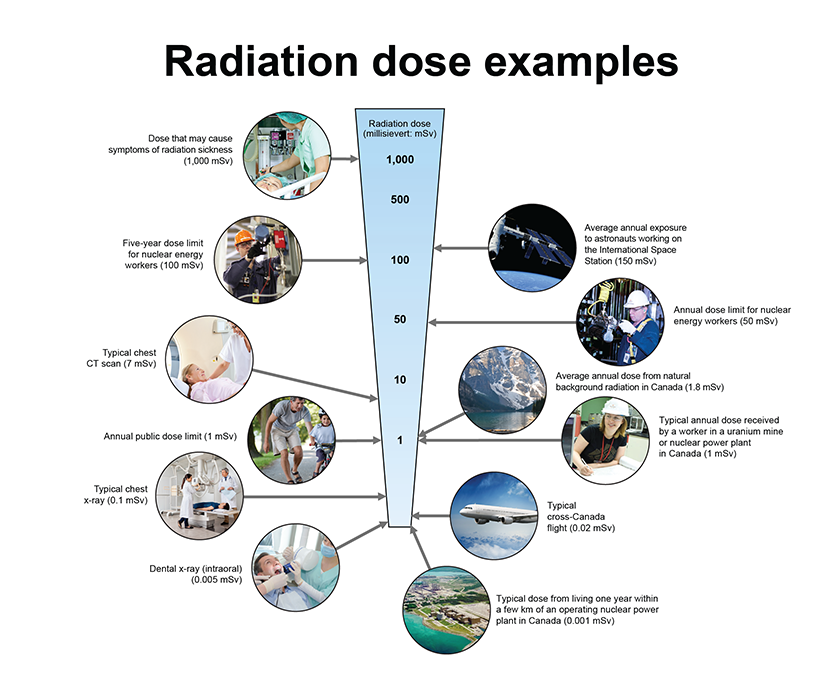
For context, let’s compare these calculated annual exposures and doses to some common examples taken from a Health Canada Radiation dose examples illustration (Figure 1):

Figure 1: Examples of typical doses received and dose limits for workers and the public.
(source: Canadian Nuclear Safety Commission)
Person A
- Lives in a home at half the Canadian guideline level, or 100 Bq/m3.
- Has an effective dose of 2.67 mSv/year.
This is in line with the existing estimates for background radiation as quoted by CNSC. Those estimates run from a mere 0.4 mSv/year annual inhalation dose in Vancouver up to a more considerable 3.2 mSv/year in Winnipeg.
Person B
- Lives in a home right at the Canadian guideline level of 200 Bq/m3.
- Has an effective dose of 5.35 mSv/year.
According to the radiation dose examples in Figure 1, this is nearing the typical 7 mSv dose received during a chest CT scan.
Person C
- Lives in an average home in Dauphin, MB, at 557 Bq/m3.
- Has an effective dose of 14.9 mSv/year.
This is equivalent to more than two 7 mSv chest CT scans per year. There aren’t any other examples in this range provided by CNSC, but if we look at Person C’s five-year dose (14.9 mSv/year × 5 years = 74.5 mSv), we see that, simply by virtue of where they happen to live (in a home with average radon levels for their town) this person is approaching the five-year dose limit for nuclear energy workers (100 mSv).
Conclusions
What conclusions can we draw from this exercise? It may be tempting to assume that these calculations overestimate the importance of radon exposure, either by inflating the number of hours spent at home, or by using reference radon levels that are well above the Canadian average. However, spending most of the day at home is a reality for an increasing number of Canadians.
Allowing for two entire hours spent outside the home daily (running errands, walking the dog, etc.) seems to be a reasonable starting point, but this could easily be adjusted if a more representative number of hours was decided upon.
As for the radon levels used in these examples, these are pertinent, real-world numbers. Both 100 Bq/m3 and 200 Bq/m3 are important decision-making thresholds for many Canadians. Even for Person C, living in Dauphin, MB, we used only the average radon level from Take Action on Radon’s recent 100 Radon Test Kit Challenge for calculation purposes; the highest indoor radon levels recorded in Dauphin were in the thousands of becquerels per cubic metre.
It’s worth noting that the 100 Radon Test Kit Challenge has gathered thousands of data points since its inception in 2018, and this data suggests that a larger percentage of Canadian homes may be above the Canadian guideline level than is currently thought.
Of the three examples in this exercise, only Person A had a calculated annual effective dose that fell within the range quoted by CNSC for annual inhaled radiation. This suggests that for many Canadians, including many living below the Canadian guideline level of 200 Bq/m3, inhaled radiation from radon makes up well over half of the average annual effective dose from natural background radiation (as is currently assumed).
Have you tested your home for radon? No matter the average radon levels in your region of the country, every home needs to test! For more information on radon, visit Take Action on Radon.
Résumé : Contributions de dose annuelle des niveaux typiques de radon à l’intérieur de bâtiments (1ère partie)
Selon la Commission canadienne de sûreté nucléaire (CCSN), le rayonnement du radon inhalé par le Canadien moyen constitue environ la moitié de la dose efficace annuelle provenant du rayonnement ambiant naturel. Même que dans certaines villes, on estime que cette quantité est nettement supérieure. Dans son article, Erin Curry, directrice régionale de l’Association canadienne des scientifiques et des technologues en radon (ACSTR), nous présente quelques données réelles pertinentes en calculant la dose efficace annuelle de radon en différentes concentrations mesurées.
Erin Curry
Erin Curry is a mechanical engineer who previously ran her own building inspection and radon measurement firm. She is currently the regional director of the Canadian Association of Radon Scientists and Technologists (CARST). She also serves as project lead for the Take Action on Radon project. Erin brings a wealth of knowledge and practical experience to support CARST members. Based near Montreal, QC, Erin is the French-speaking contact for all CARST initiatives.
Do you want to read more articles like this?
The Bulletin is published by the Canadian Radiation Protection Association (CRPA). It’s a must-read publication for radiation protection professionals in Canada. The editorial content delivers the insights, information, advice, and valuable solutions that radiation protection professionals need to stay at the forefront of their profession.
Sign up today and we’ll send you an email each time a new edition goes live. In between issues, check back often for updates and new articles.
Don’t miss an issue. Subscribe now!
Subscribe


